From Event Streams to Insight: Building the KORE SUPER SIM Dashboard
Hi there, my name is Vitor Ribeiro, and I am a Solutions Architect at KORE Wireless.
This article is a technical deep-dive into turning KORE SUPER SIM event streams into a real-time, pre‑sales–ready dashboard. It’s a new, standalone post that builds on two earlier pieces and consolidates them into one. Previous articles in this series:
- Part 1: Getting Started with KORE SUPER SIM Event Streams
- Part 2: KORE SUPER SIM Heatmap Using Event Streams
Those posts introduced the concepts and an initial visualization experiment. This one goes further: it focuses on architecture, implementation details, and design decisions, using the KORE Super SIM Dashboard as a concrete reference.
👉 Source code: https://github.com/naturalfunction/KORE-SUPERSIM-Dashboard

The dashboard is deployed behind my domain vitorribeiro.com using Cloudflare, connected to live SUPER SIM event streams, and was built specifically to support pre‑sales and technical demonstrations as well as prospects looking to validate KORE SUPER SIM API & Event Streamer.
Motivation: Why Build a Dashboard at All?
During pre‑sales conversations, KORE SUPER SIM capabilities are often explained using:
- Static slides
- API documentation page
- Pipedrive or N8N applications
While useful, those approaches struggle to convey one key idea:
Super SIM is fundamentally event-driven.
KORE SUPER SIM Event Streams provide a continuous, near–real-time signal about what SIMs are actually doing in the field. A live dashboard makes that tangible:
- Events arrive as I turn on/off my devices
- Visualizations change immediately
- Questions can be answered on the spot
The dashboard exists to demonstrate possibilities, not just metrics.
Event Streams Recap (Context from Part 1)
KORE SUPER SIM Event Streams deliver lifecycle and usage events via webhooks. From an implementation perspective, the important characteristics are:
- Push-based delivery (no polling)
- High variability in event frequency
- At-least-once delivery semantics
- Structured but evolving payloads
This immediately influences system design:
- Webhook endpoints must be fast and resilient
- Ingestion must be idempotent
- Storage must support both raw and derived data
The dashboard architecture reflects those constraints.
System Architecture Overview
At a high level, the KORE SUPER SIM Dashboard is composed of five layers:
- Event source — KORE SUPER SIM Event Streams
- Ingress — Flask-based webhook API service
- Normalization — CloudEvents 1.0 parsing and enrichment
- Persistence & aggregation — SQLite with automatic retention
- Presentation — Real-time dashboard UI with auto-refresh
Each layer is intentionally simple and loosely coupled, built with Flask for rapid development and easy deployment.
Technical Implementation Stack
The dashboard is built using modern Python technologies:
- Backend: Flask web framework
- Database: SQLite with automatic cleanup (4-month retention)
- Security: KORE signature verification with JSON minification
- Frontend: HTML/CSS/JavaScript with real-time updates
- Deployment: Nginx + systemd service configuration included
Key Features Implemented
✅ Webhook Security - KORE signature verification with proper JSON minification
✅ CloudEvents 1.0 Support - Receives KORE SUPER SIM event streams
✅ SQLite Database - Persistent storage with automatic data retention
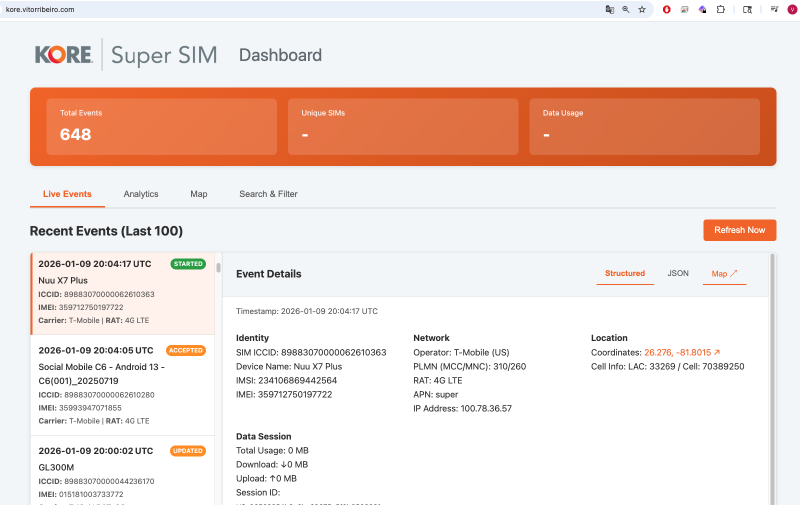
✅ Real-time Dashboard - Live event monitoring with auto-refresh
✅ Analytics & Charts - Visualize data usage, network distribution, and event types
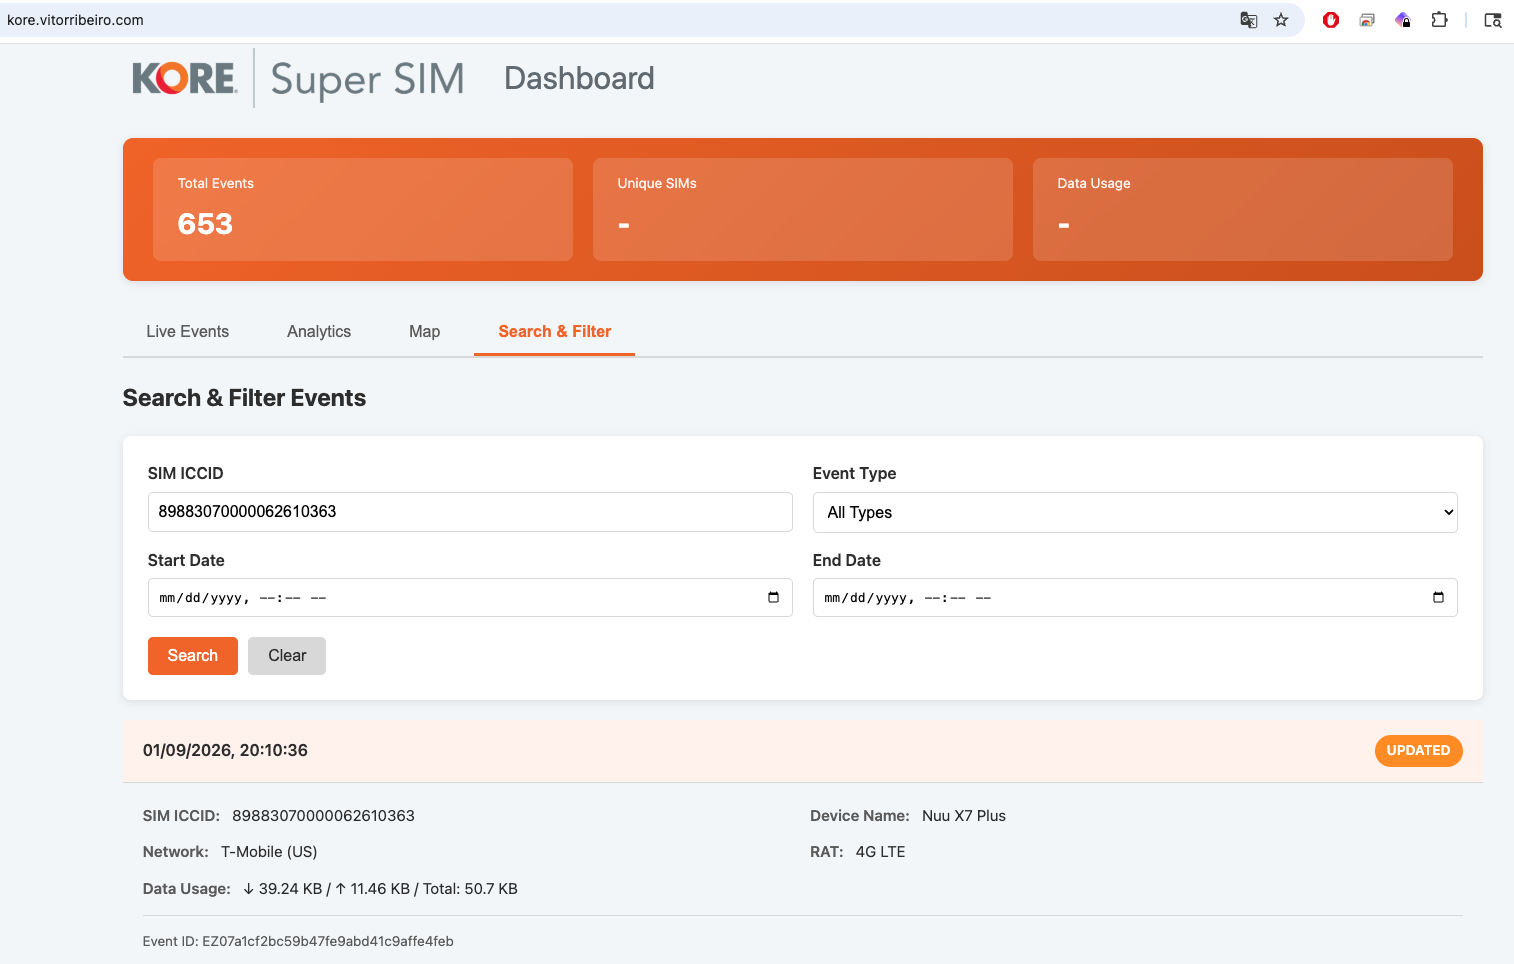
✅ Search & Filter - Find events by ICCID, type, date range, and more
✅ Production Ready - Nginx configuration, systemd service, and deployment guides
Webhook Ingestion Layer
The Flask-based webhook service handles KORE SUPER SIM CloudEvents with these core responsibilities:
- Accepting events reliably via
/webhook/superendpoint - Validating KORE signatures using the
kore-signatureheader - Processing CloudEvents arrays in JSON format
- Storing normalized data in SQLite
Webhook Endpoint Implementation
The webhook endpoint processes CloudEvents arrays with proper security verification:
| |
Key design choices:
- Signature verification prevents unauthorized webhook calls
- Batch processing handles CloudEvents arrays efficiently
- Defensive parsing manages schema evolution gracefully
- Structured logging captures every event for debugging
This keeps the webhook responsive even during bursty traffic—important both operationally and when demonstrating live systems.
Getting Started with the Repository
The KORE SUPER SIM Dashboard is designed for easy setup and deployment. Here’s how to get it running:
Quick Start Guide
- Clone and Setup
| |
- Configure Environment
| |
- Initialize Database
| |
- Start the Application
| |
KORE Event Stream Configuration
To connect your dashboard to live SUPER SIM events:
In KORE Developer Console:
- Go to Event Streams → Destinations
- Create a new Webhook destination
- Set URL to:
https://your-domain.com/webhook/super - Set the webhook secret to match your
KORE_WEBHOOK_SECRET
Create Streaming Rule:
- Create a Streaming Rule to forward events to this destination
- Select event types: connection, data usage, state changes
Dashboard Views
The dashboard provides three main interfaces:
- Live Events - Real-time event stream with auto-refresh
- Analytics - Charts showing data usage, network distribution, event types
- Search & Filter - Find specific events by ICCID, type, date range
API Endpoints
The dashboard exposes several REST endpoints:
POST /webhook/super- Receives KORE SUPER SIM CloudEventsGET /api/events- Returns paginated events with filteringGET /api/stats- Returns analytics data and breakdownsGET /health- Application health status and database statistics
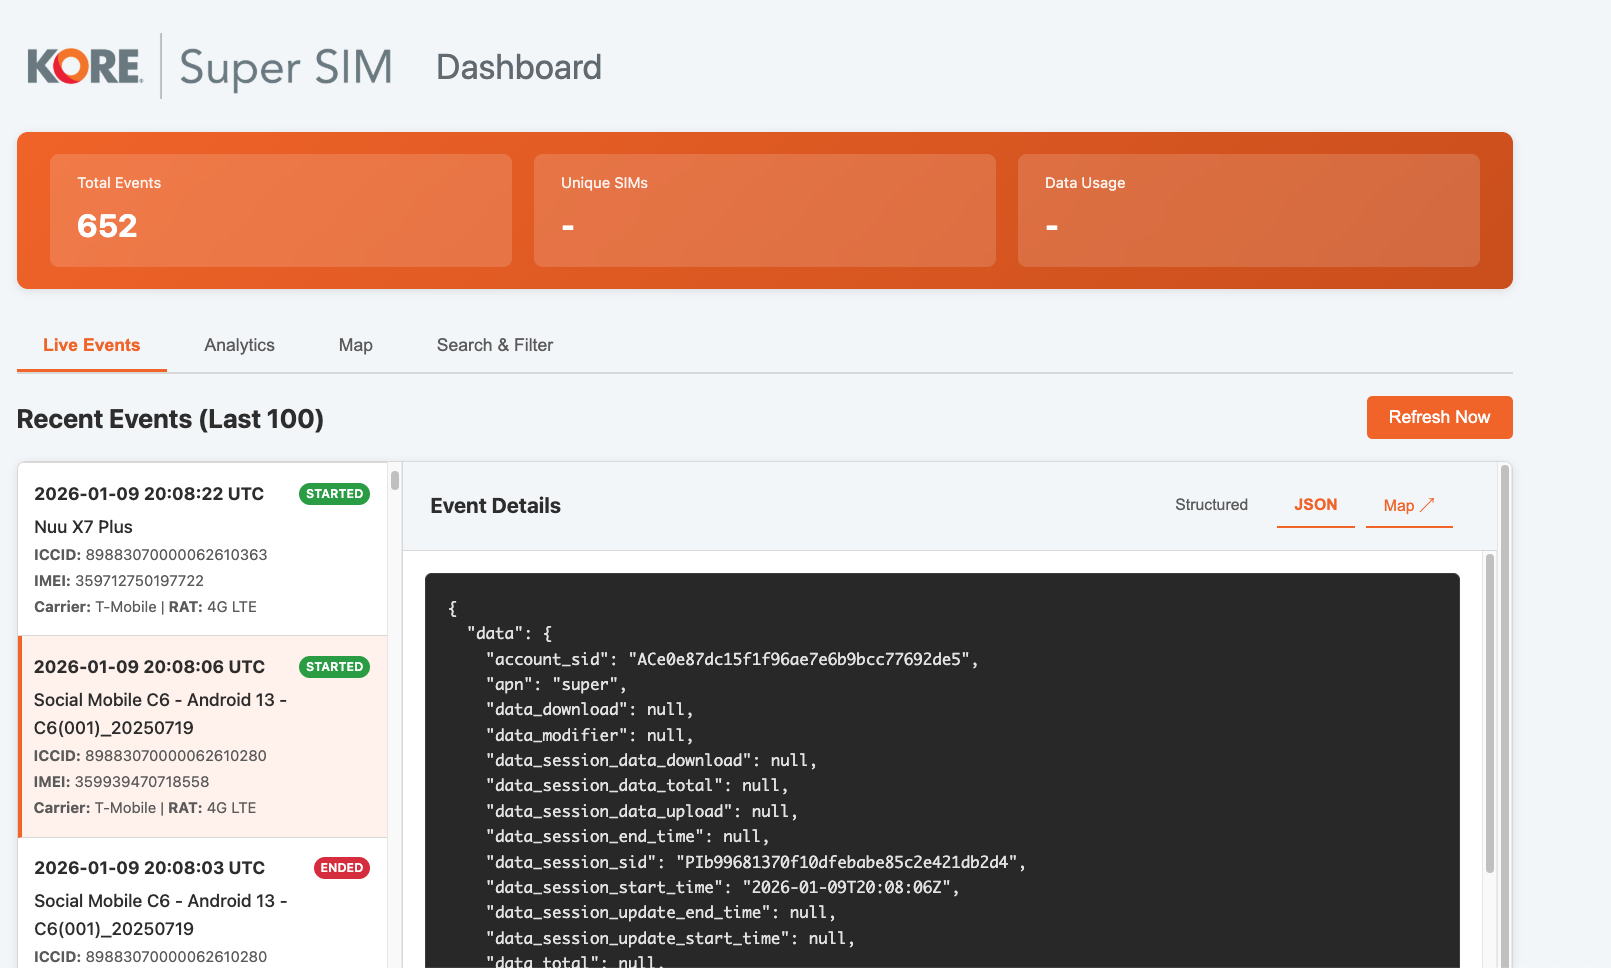
Event Normalization and Modeling
Raw SUPER SIM events are useful, but not presentation-friendly.
The dashboard introduces an internal event model that:
- Abstracts vendor-specific naming
- Normalizes timestamps and identifiers
- Extracts fields relevant to visualization (state, location, volume)
This layer is what makes it possible to add new charts without rewriting ingestion logic.
Aggregation Strategy
Dashboards are read-heavy systems. Querying raw event logs directly does not scale well, especially during demos.
Instead, events are aggregated into structures optimized for:
- Time-series counts
- Geographic intensity maps
- State distributions
This allows the UI to remain responsive even as historical data accumulates.
Data Retention and Management
The dashboard includes intelligent data management:
- Automatic cleanup - Events older than 4 months (120 days) are automatically deleted
- Daily maintenance - Cleanup job runs at 2:00 AM to manage database size
- Manual cleanup -
python app.py cleanupfor immediate maintenance - Backup support - SQLite database can be easily backed up and restored
Production Database Options
While SQLite works well for development and small deployments, production environments can use:
| |
The Flask application automatically adapts to different database backends through SQLAlchemy.
Geographic Heatmaps (Context from Part 2)
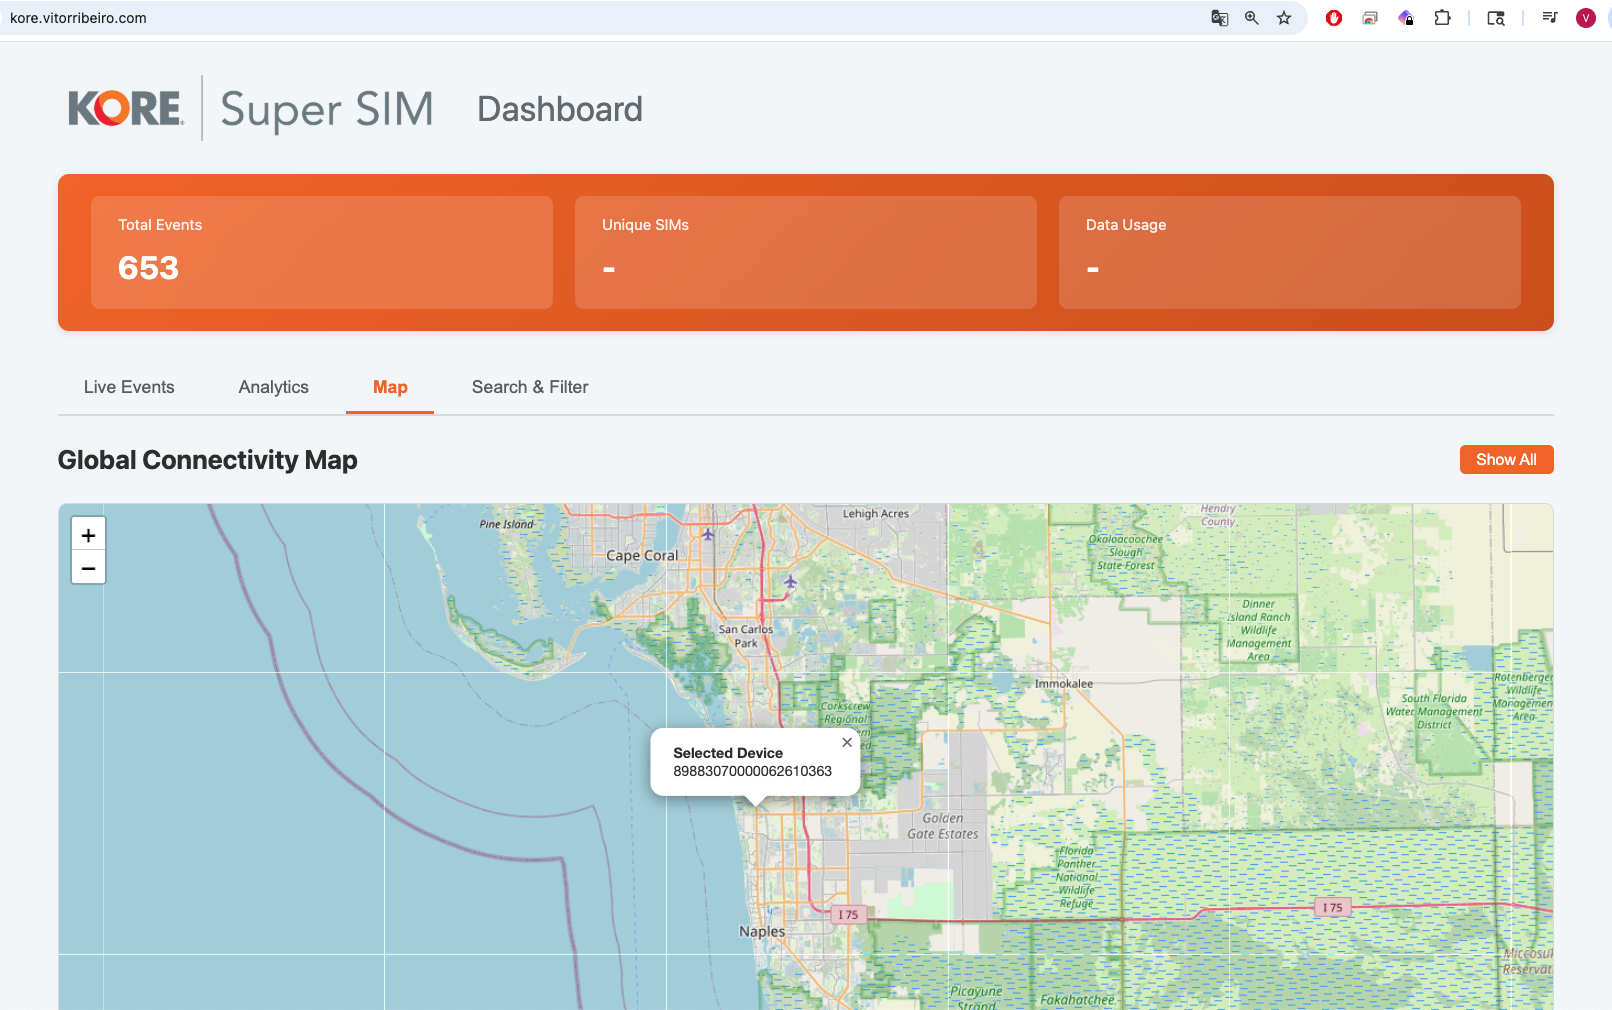
The heatmap explored in Part 2 is fully integrated into the dashboard.
Implementation details:
- Location fields are extracted at ingest time
- Events are bucketed geographically
- Intensity reflects relative activity, not absolute counts
From a pre‑sales perspective, this visualization is particularly effective because it:
- Immediately communicates global reach
- Highlights roaming behavior
- Makes anomalies obvious without explanation
Frontend Design Considerations
The UI is designed around situational awareness, not reporting.
That means:
- Live indicators instead of static tables
- Visual density over precision
- Fast load times over exhaustive detail
Every element answers the same question:
What is the SIM fleet doing right now?
Real Deployment, Real Constraints
This dashboard is not running against mocked data.
It is:
- Deployed to a public domain
- Connected to live SUPER SIM event streams
- Subject to real-world traffic patterns
That exposed practical concerns often missed in examples:
- Duplicate events
- Out-of-order delivery
- Regional data inconsistencies
All of these influenced the final design and are reflected in the code.
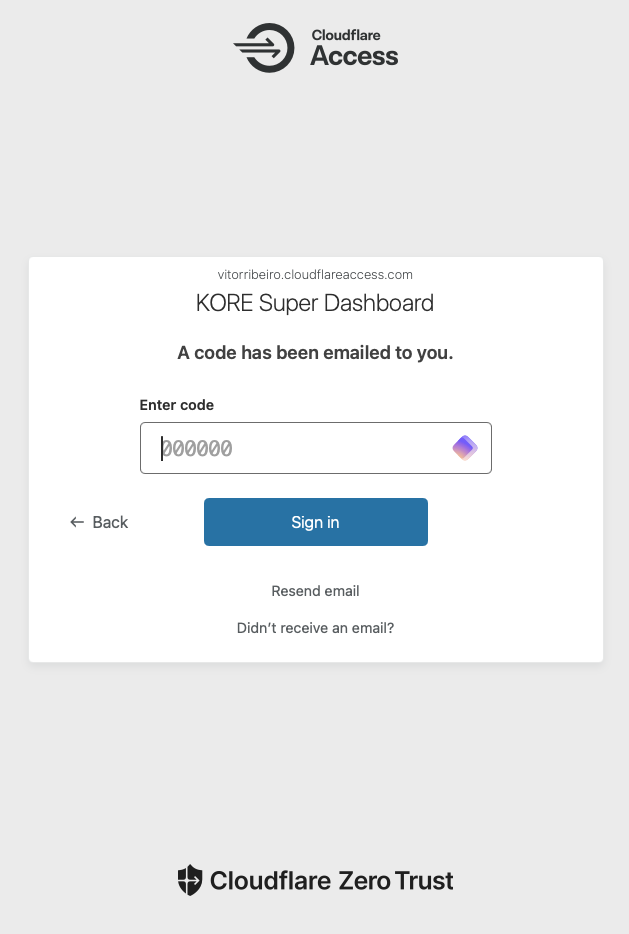
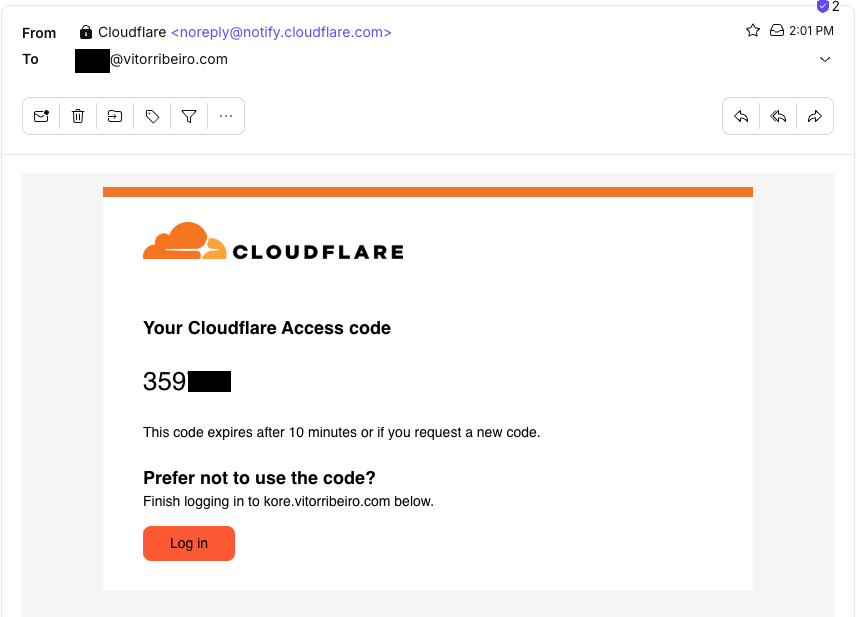
Here’s a glimpse of Cloudflare Access and how I can open this Dashboard anywhere or any computer.
Production Deployment Guide
The repository includes production-ready configurations for enterprise deployment:
Security Checklist
⚠️ Before deploying to production:
- Generate your own webhook secret in the KORE Developer Portal
- Update environment variables with your actual values
- Never commit real secrets to version control
- Use HTTPS for all webhook endpoints (KORE requirement)
- Configure proper firewall rules and access controls
Nginx Configuration
Sample production web server configuration:
| |
Systemd Service
For production deployment as a system service:
| |
Troubleshooting Common Issues
Webhook signature verification fails:
- Verify
KORE_WEBHOOK_SECRETmatches the secret in KORE Developer Console - Check that webhook URL uses HTTPS (required by KORE)
- Ensure JSON payload is not modified in transit
Events not appearing:
- Check webhook endpoint logs for errors
- Verify streaming rules are configured correctly
- Confirm SIMs are generating events (active data sessions)
Database issues:
- Check disk space for SQLite database growth
- Verify database permissions and file access
- Monitor cleanup job execution in logs
Why This Matters for Pre‑Sales
In pre‑sales discussions, credibility is everything.
A live, event-driven dashboard:
- Demonstrates platform maturity
- Encourages technical questions
- Shifts conversations from features to architecture
Instead of explaining what could be built, you show what already exists.
Explore the Repository
🔗 KORE SUPER SIM Dashboard
https://github.com/naturalfunction/KORE-SUPERSIM-Dashboard
The repository includes comprehensive implementation details:
Complete Flask Application
- Webhook ingestion with KORE signature verification
- CloudEvents 1.0 processing and normalization
- SQLite database with automatic retention policies
- Real-time dashboard with live event monitoring
- REST API endpoints for events, statistics, and health checks
Production-Ready Deployment
- Nginx configuration for reverse proxy setup
- Systemd service files for Linux deployment
- Environment configuration templates and examples
- Security guidelines and deployment checklists
Project Structure
| |
Key Implementation Features
Modern Python Packaging:
- Uses
pyproject.tomlfor dependency management - Compatible with Python 3.8+ environments
- Includes development and production dependency sets
Database Flexibility:
- SQLite for development and small deployments
- PostgreSQL/MySQL support for production scaling
- Automatic schema migrations and data retention
Security Implementation:
- KORE webhook signature verification
- Environment-based configuration management
- HTTPS enforcement for production deployments
It is intentionally readable and extensible—designed to support experimentation, customization, and production deployment.
Closing Thoughts
KORE SUPER SIM Event Streams enable a fundamentally different way of thinking about connectivity data.
By building directly on the event stream—without reverting to batch reports—you gain:
- Real-time visibility
- Stronger demos
- Better technical conversations
The KORE SUPER SIM Dashboard is one practical example of how to turn that stream into insight.
Want to explore more KORE Super SIM capabilities? Check out my other articles on Event Streams and real-time visualization.
