![]()
Visualizing KORE SUPER SIM Event Streams in Real Time
Hi there, my name is Vitor Ribeiro, and I am a Solutions Architect at KORE Wireless.
In this article, I’ll show you how I built a full real-time geospatial visualization tool for KORE SUPER SIM using the Event Streams, FastAPI, and Leaflet using OpenAI Codex
You can download the code from my GitHub repository here
New to Event Streams? Start with my Getting Started with KORE SUPER SIM Event Streams guide first.
⭐ What the App Does
Super SIM Heatmap provides:
- Real-time Super SIM event ingestion
- Persistent storage of CloudEvents payloads
- Dual online/offline heatmap layers
- Timeline slider for replay
- Device event feed with metadata
- Click-to-pan tower visualization
🌍 Why Visualize Super SIM Events?
KORE SUPER SIM emits session lifecycle events such as:
connection.data-session.startedconnection.data-session.updatedconnection.data-session.ended
Visualizing them helps teams understand connectivity patterns and issues across geography and time.
🧱 Architecture Overview
| |
⚡ Webhook Ingestion
The webhook endpoint:
| |
Validates, extracts, and persists raw event payloads.
🔥 Dual-Layer Heatmap
- Green = online
- Red = offline
State is inferred by latest event per ICCID.
⏱ Timeline Scrubbing
Scrub 00:00–23:59 and reconstruct fleet activity by timestamp.
📋 Device Event Sidebar
Shows:
- ICCID
- Tower
- Network
- RAT
- Timestamp
🤖 Synthetic Data Seeder
Simulates START → UPDATE → END events across global cities.
Example:
| |
🧪 Manual cURL Tests
Includes samples for all session lifecycle events.
🖥 Web UI Overview
- Device sidebar
- Heatmap toggles
- Timeline slider
- Stats counters
📁 Project Structure
| |
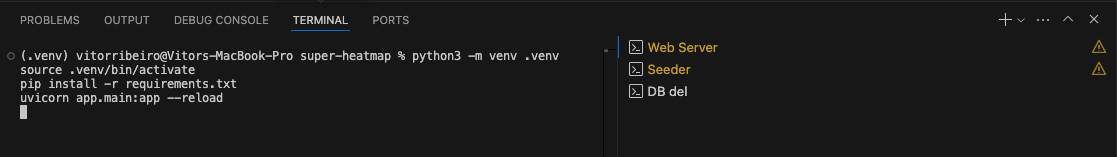
🛠 Quick Start
| |
🛠 Seed sample data
50 devices in Naples, ~550 sessions total
| |
30 devices in every region, 5 sessions each
| |
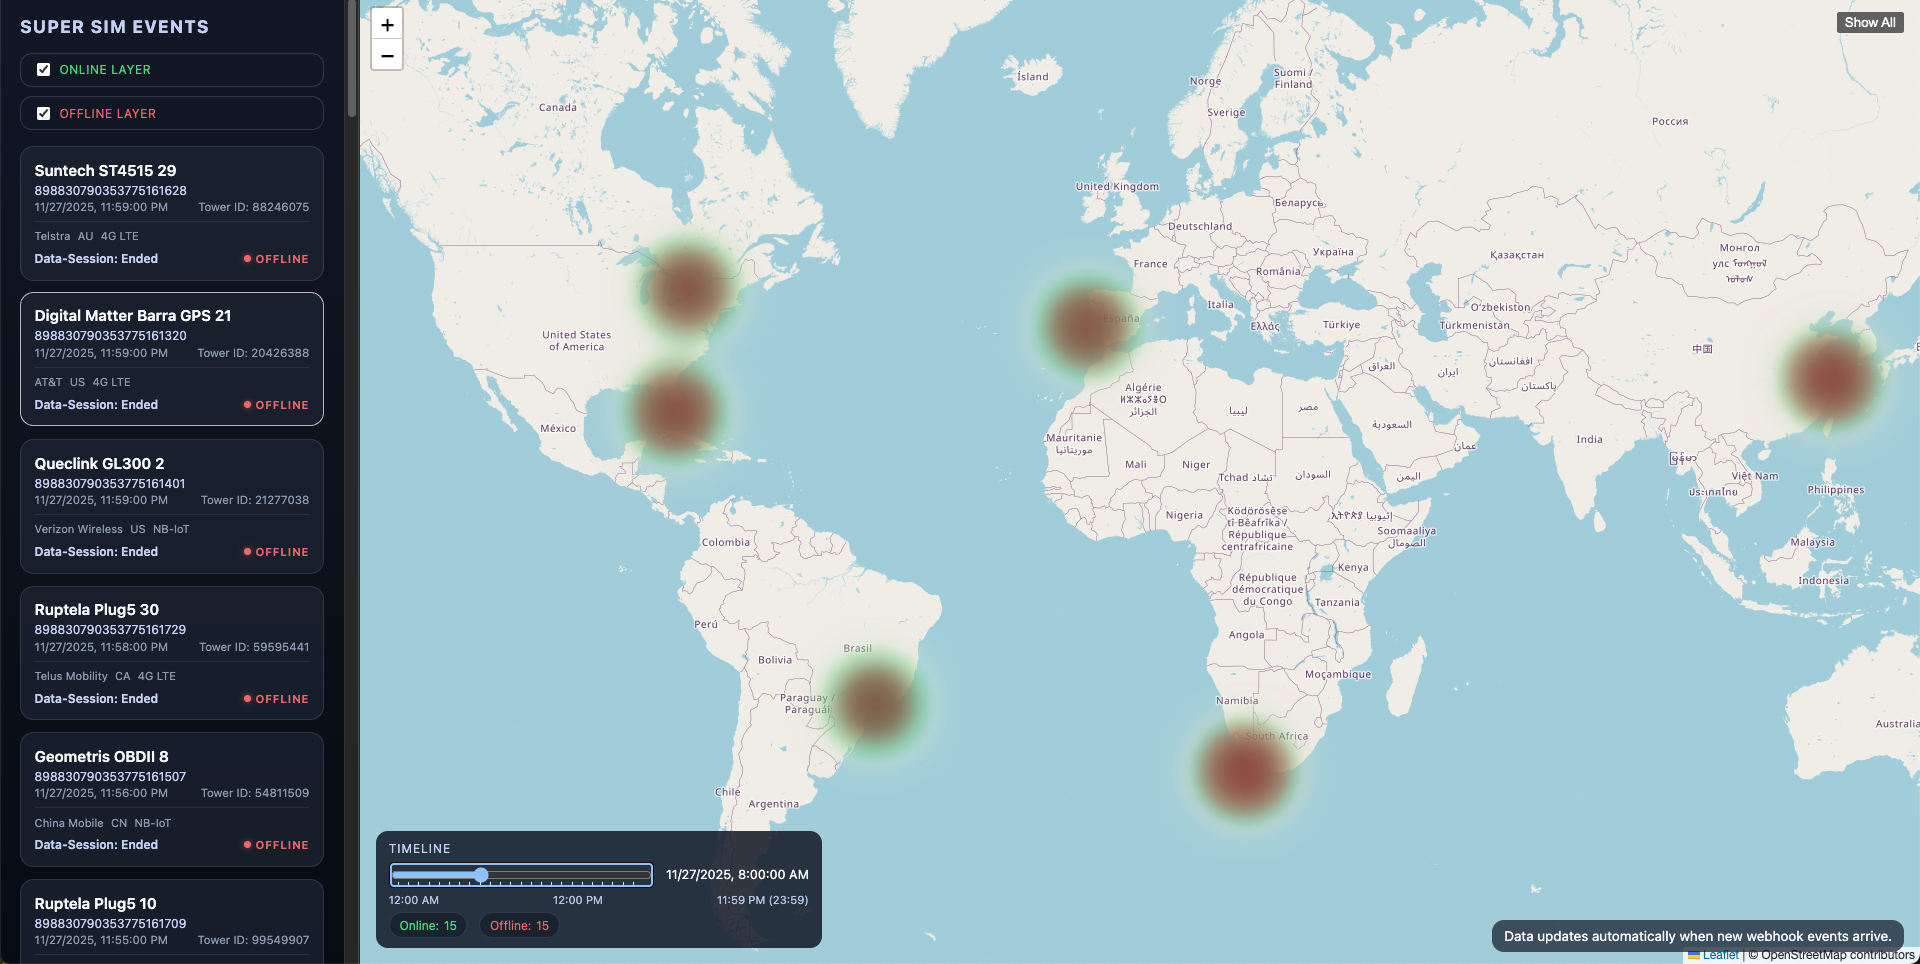
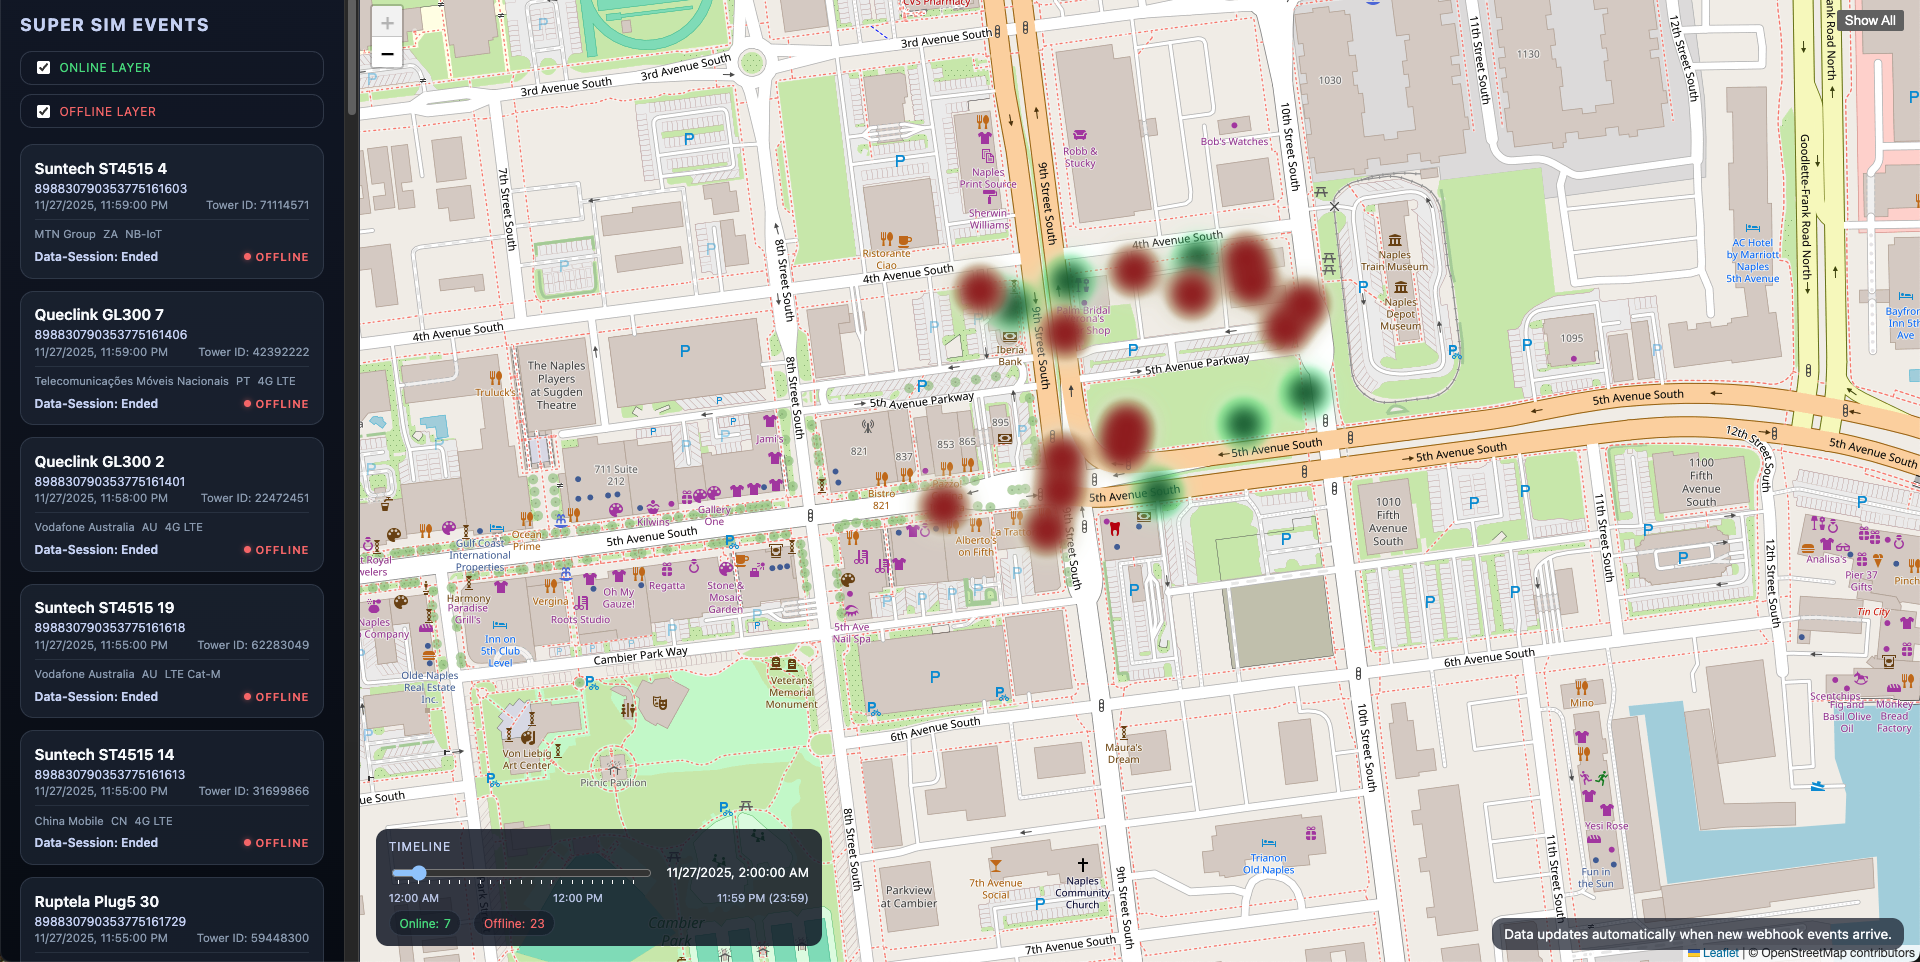
🛠 Map Examples
Map after seeding data
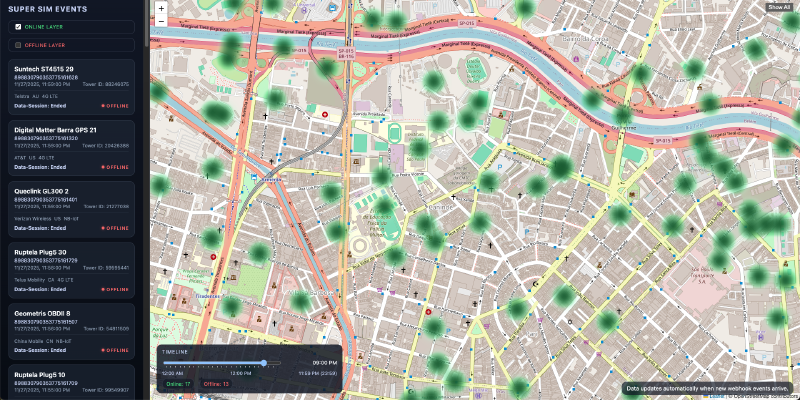
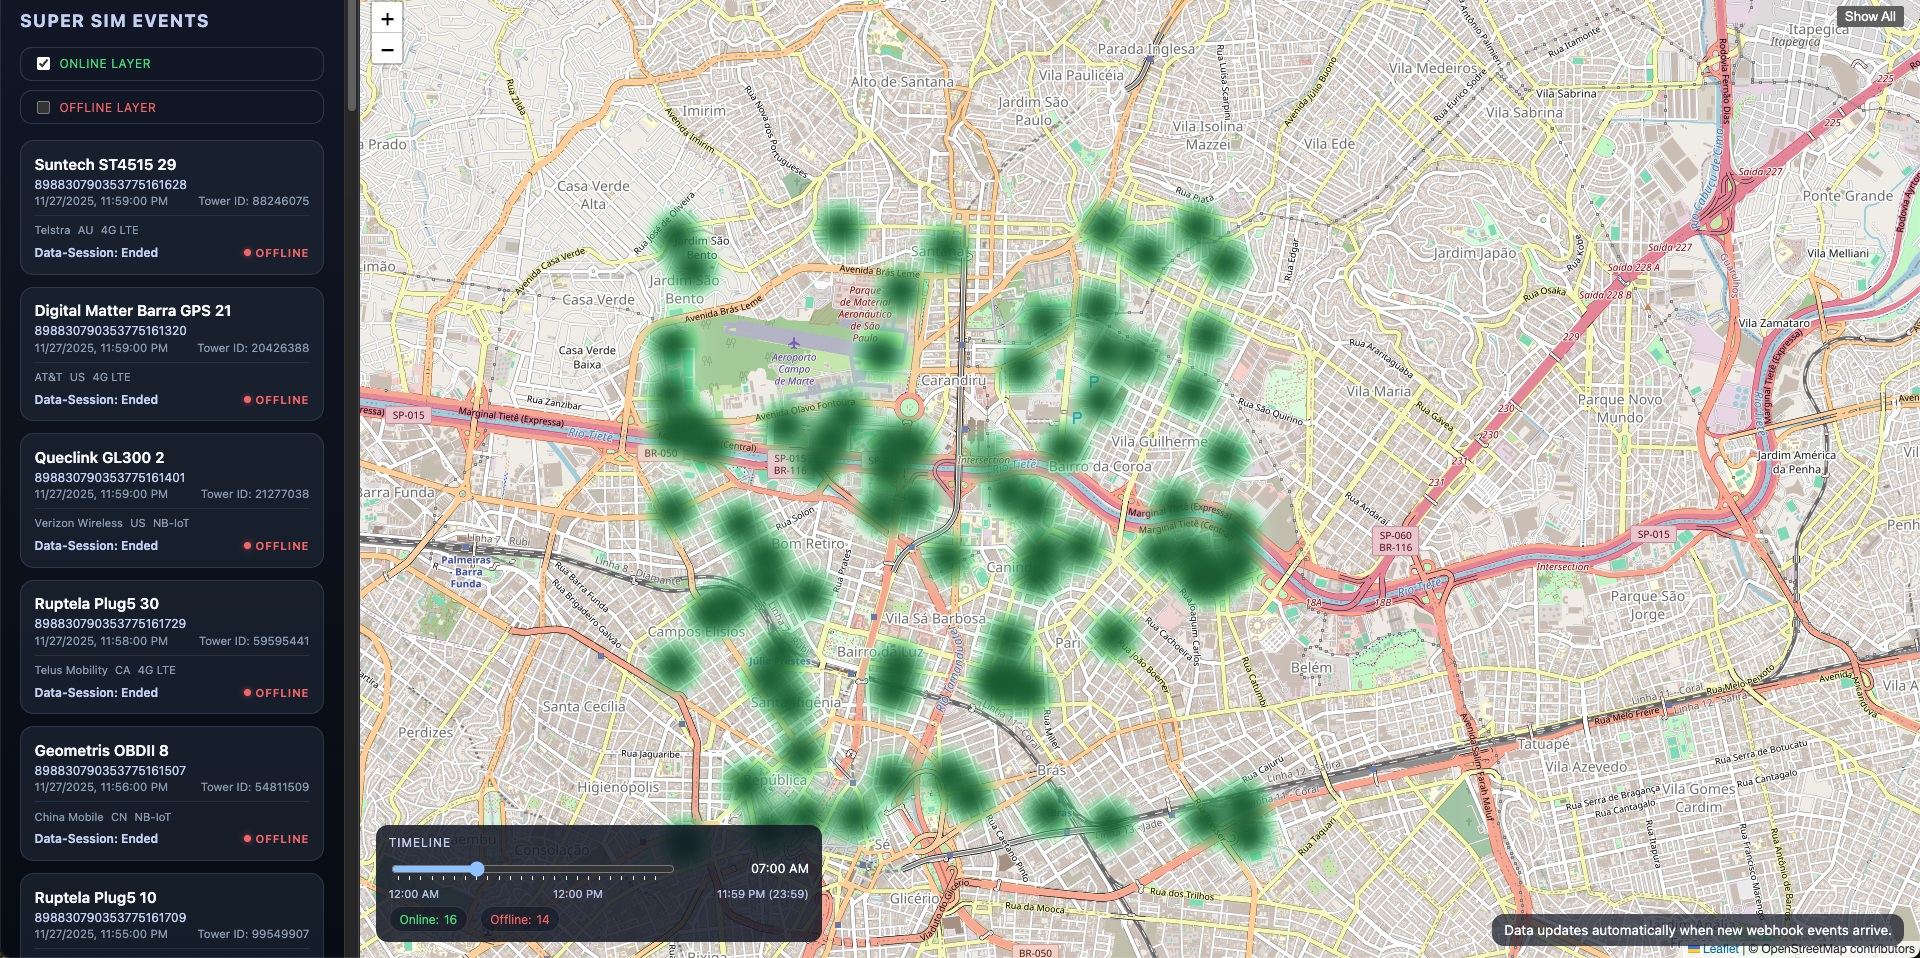
Map after filtering data using the Timeline
Map after filtering data using the Timeline Online Only.
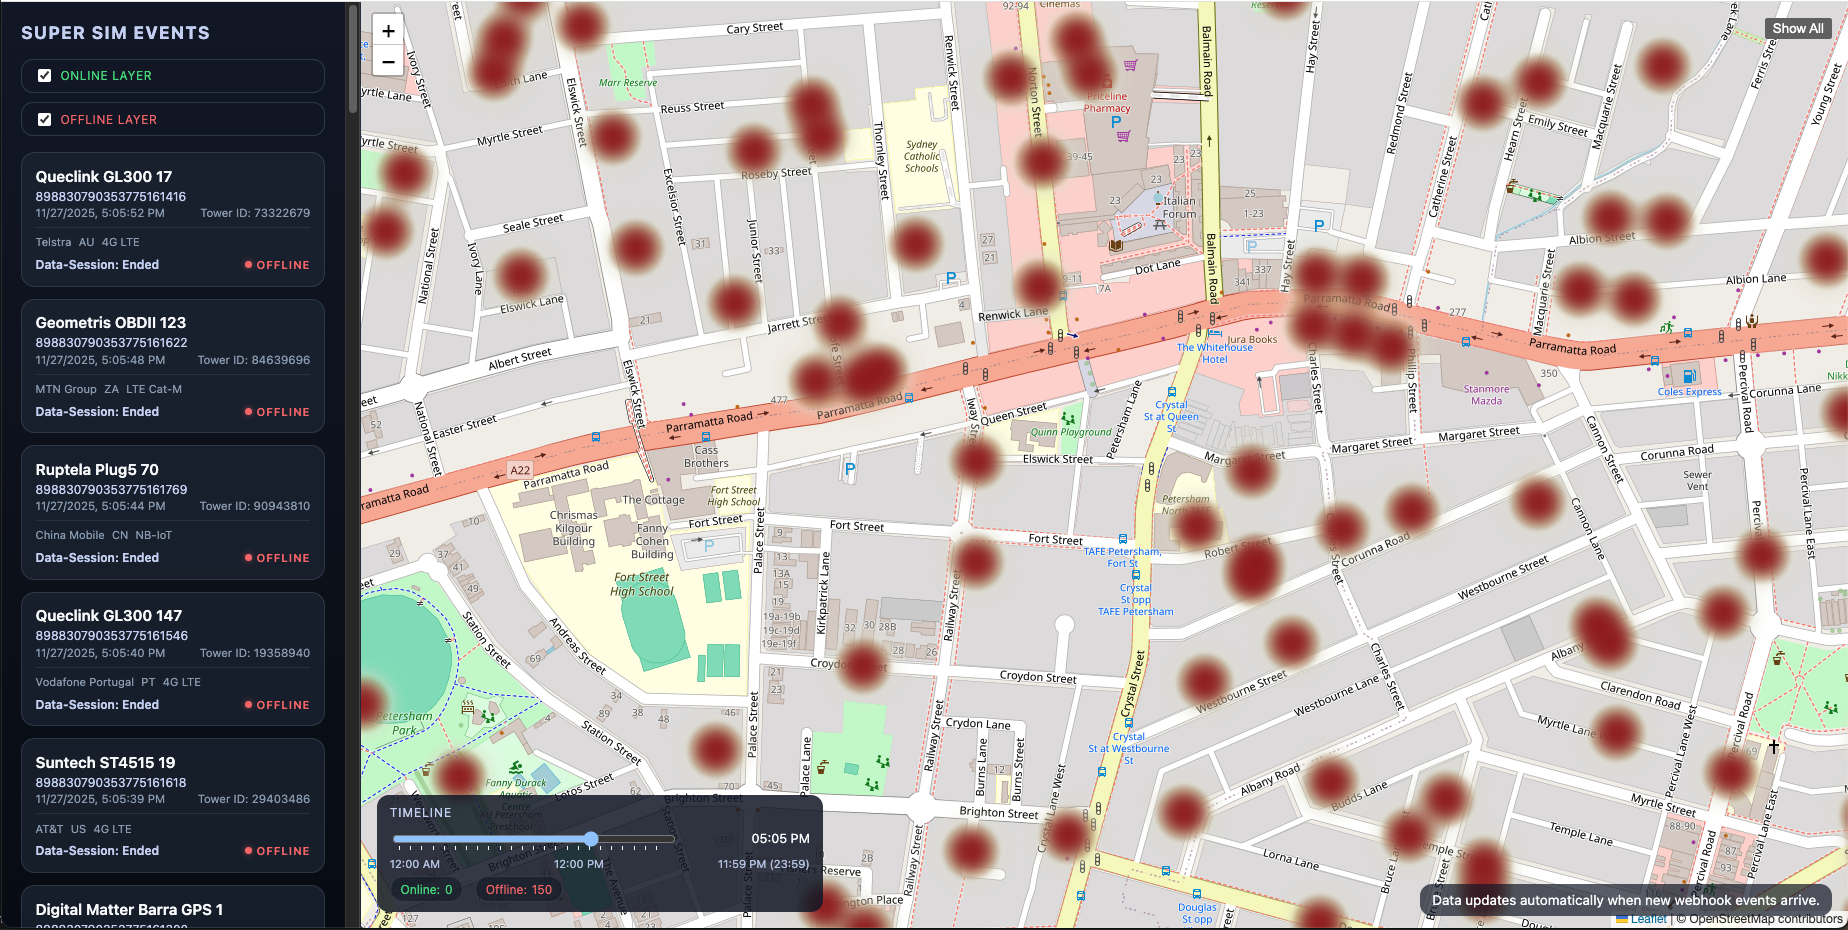
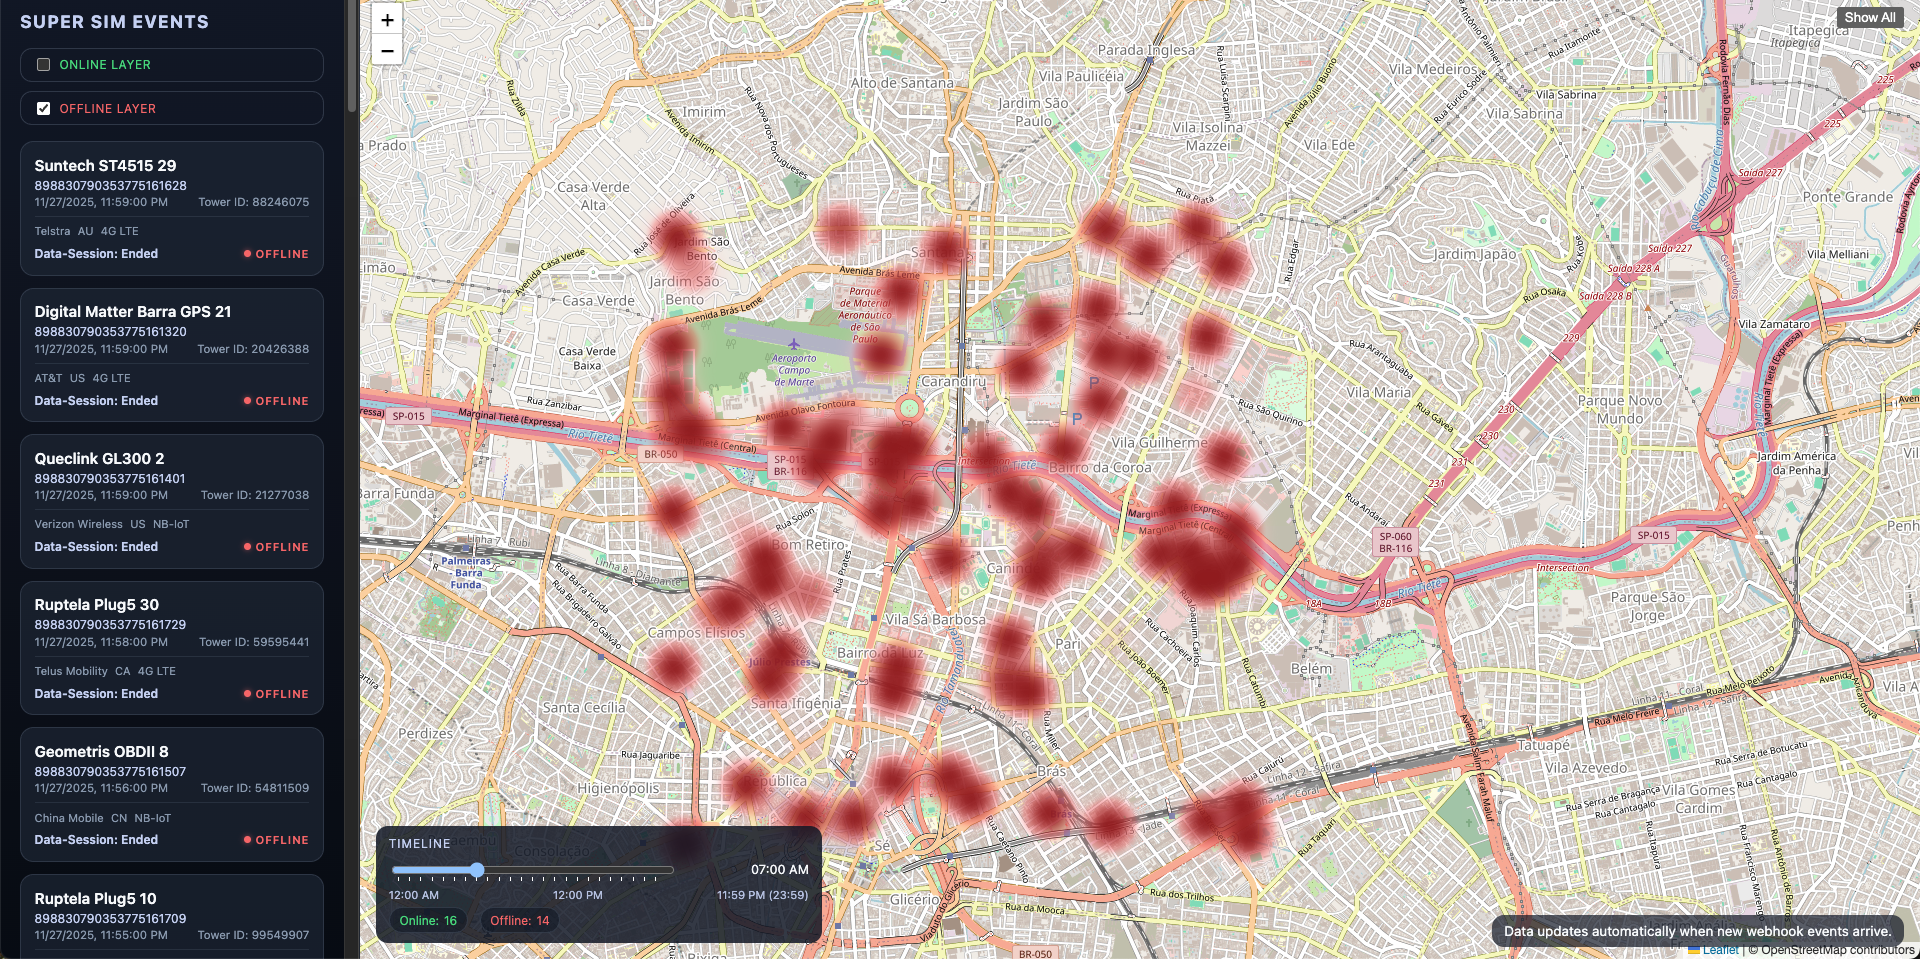
Map after filtering data using the Timeline Offline Only.
Map after clicking SHOW ALL